Setup real-time source localization example
| Please note: The information provided on this page might be outdated and will be updated soon. |
This tutorial will show how you can setup an acquisition and processing chain in MNE Scan, which makes use of the real-time source localization method RTC-MNE.
The following steps will show you how to setup the online processing pipeline in MNE Scan:
- Make sure you downloaded and correctly extracted the MNE Sample data set. If not, check for a step by step guide here. On MacOS please make sure that you copied the MNE Sample data set to mne_scan.app/Contents/MacOS/ as well.
- Start mne_rt_server in your mne-cpp/bin folder. It is important that the mne_rt_server is started before the mne_scan executable.
- Start mne_scan in your mne-cpp/bin folder.
- Navigate to the Sensor Plugins and Algorithm Plugins buttons in the plugin window. Select and position the following plugins onto the plugin scene:
- Sensor Plugins - FiffSimulator
- Algorithm Plugins - Averaging
- Algorithm Plugins - Covariance
- Algorithm Plugins - MNE
- Select the Connection tool in the plugin window. Connect the plugins as follows by left clicking on the start, holding and releasing above the target plugin.
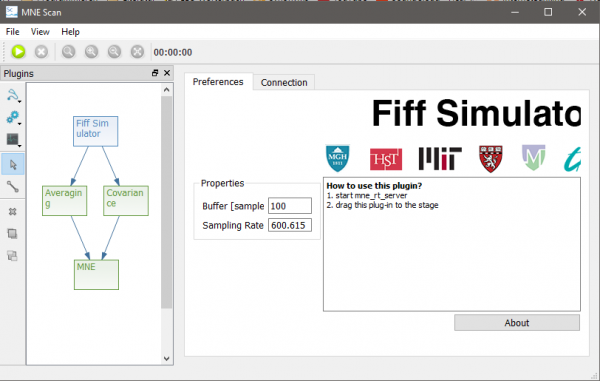
- Click on the MNE plugin and wait until the Start Clustering button is clickable again.
- Click on the Fiff Simulator plugin.
- Start the pipeline by clicking on the green play button in the left upper corner.
Now that you setup and are running the data acquisition/processing pipeline, we can start to configure some parameters for the online processing:
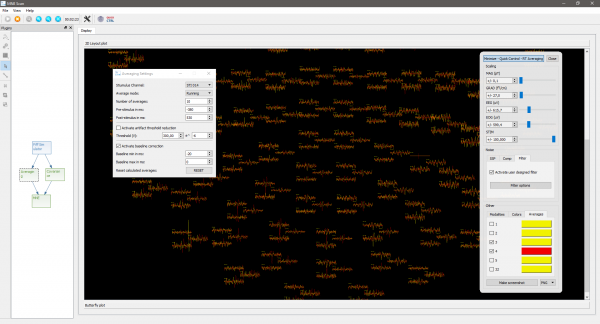
- Click on the Averaging plugin.
- Click on the Averaging Adjustments button in the toolbar.
- Choose the correct trigger channel. Since we are making use of the MNE-Sample-Data-Set choose STI014.
- Once the averages are starting to come in you can take a look at the averaged data in form of a butterfly and 2D layout plot.
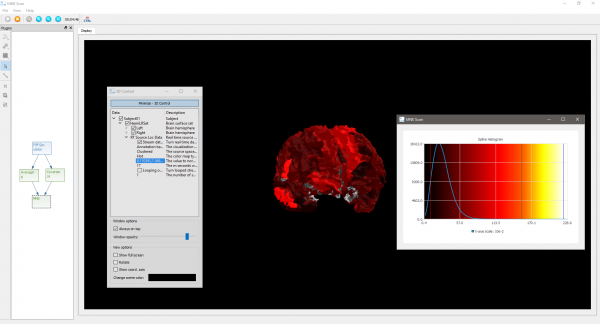
- Click on the MNE plugin.
- Select the 3D Control from the toolbar.
- Navigate to the Data item.
- Now click on the item with the description “The value to normalize the source localization result”.
- You should be prompted with the histogram based thresholding window. Use the right, middle and left mouse button to set the thresholds.
- The 3D view can be rotated using the middle and translated using the right mouse button.